CNT Distribution Determination with CNN
CNT Distribution Determination with CNN
1.Brief Summary
The objective of this research is to classify whether sonication is applied or not in concrete through CNN model. Prescribed code shows 0.6625 of accuracy. In this research, accuracy of detection was increased with simple method. First, we add more image of concrete with CNT and UHPC to enforce the model. And secondly, we adopt pixel histogram as a pre-processing procedure to utilize distribution uniformity in our model. For doing so, we change our convolution model from Conv2D to Conv1D. Consequently, the accuracy of improved model increased to 0.9016.
2.Introduction
1.CNN Model
![Figure 1 The Architecture of CNN Model[1]](/assets/images/deeplearningstructure.png) Figure 1 The Architecture of CNN Model[1]
Figure 1 The Architecture of CNN Model[1]
A Convolutional Neural Network(ConvNet/CNN) is Deep Learning algorithm which can take in an input image, assign importance (learnable weights and biases) to various aspects/ ovjects in the image and be able to differentiate one from the other. It has the advantage over the other classification algorithm as lower requirements in pre-processing. And also, CNN have the ability to learn appropriate filters/kernels while the other classification algorithm needs hand-engineered and sufficiently trained preset filters. It is widely used for classify visionary problem.
2.Convolution
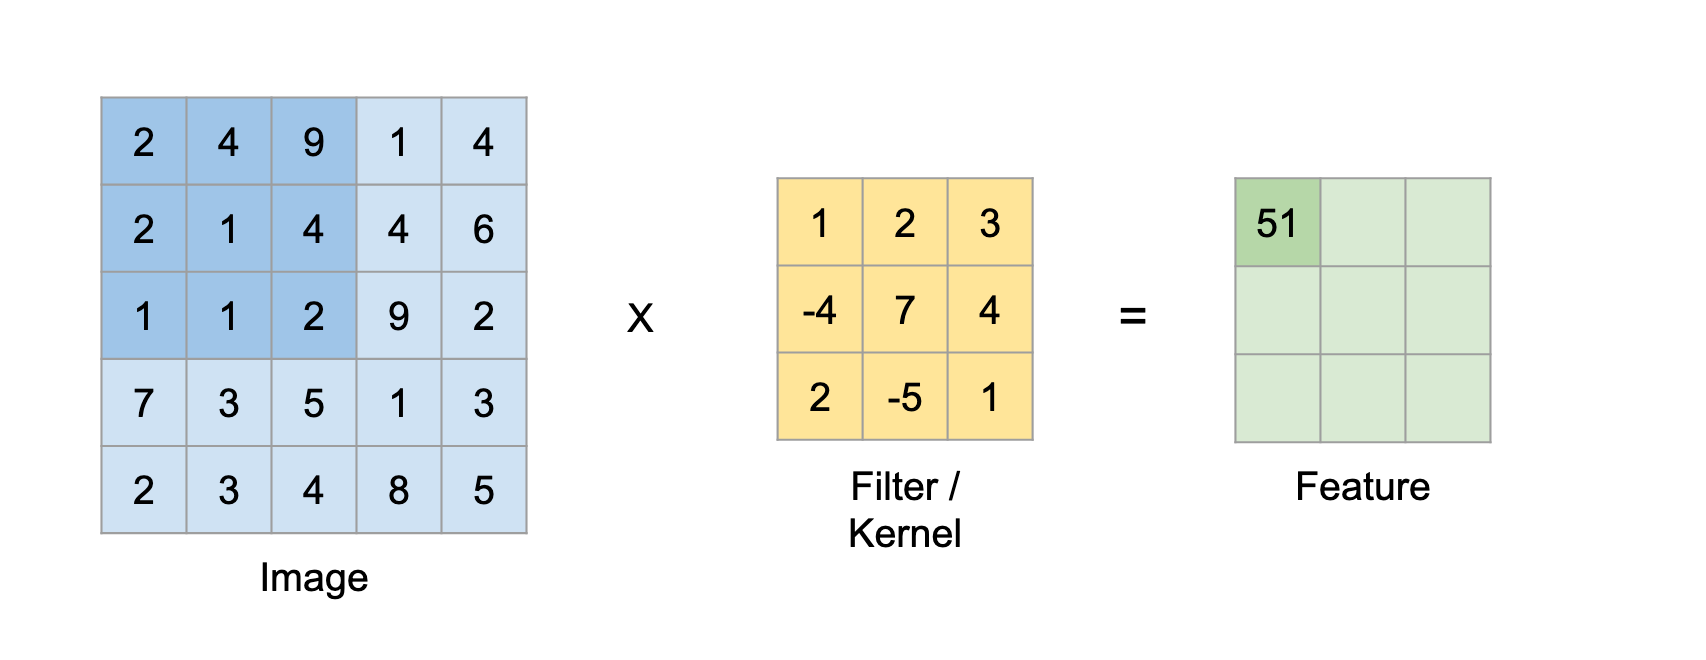 Figure 2 Example of Convolution process
Convolution is one of mathematical operation on two function that produces a third function that expresses how the shape of one is modified by the other. In the CNN Model, it is used to produce new value to contains information related to computer vision. There are many variation in detail. In the previous code, convolution 2D was adopted to make new layer of model. The number of layer was four and each kernel size was (3,3) ant the numbers of each layer’s filters were 64, 64, 128 and 256 filters, respectively. All the layer use ‘glorot_normal’ method as kernel initializer and relu function as activation. Also, they adopt padding which is one of technique decreases a loss of original data by appending a border of zeros and calculating the convolution covering all the input values.
3.Maxpool
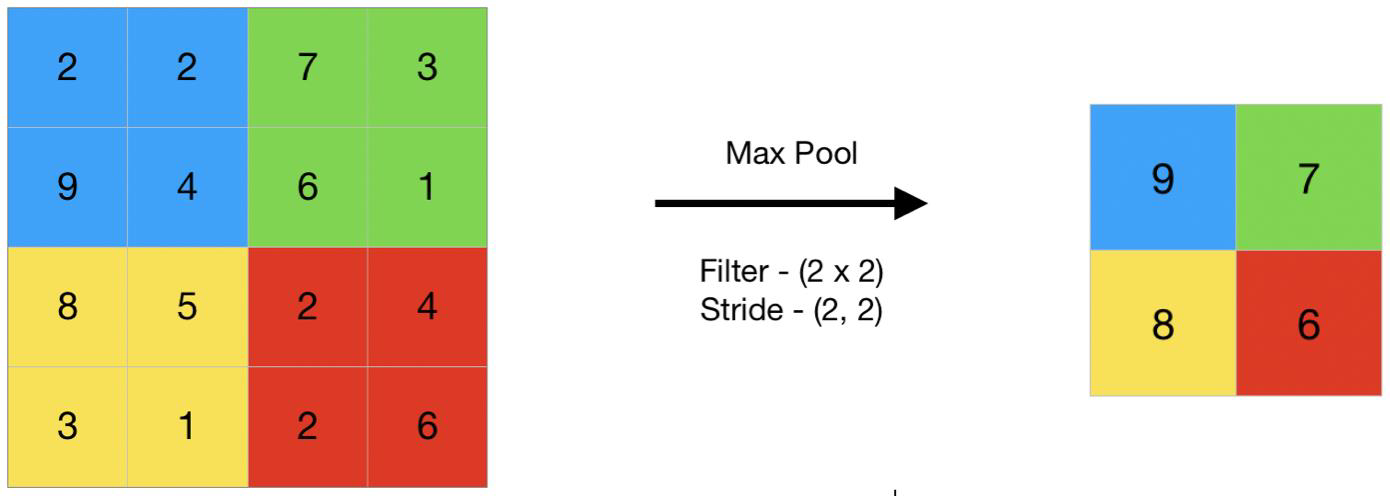 Figure 3 Example of Maxpool process
The pooling refers to a small portion generally, in the CNN Model, it is used for decrease the size of sample. There are many types of pooling method, for example, average pooling takes the average value of filter while maximum pooling take the maximum value of filter. Usually, 2×2 filter with stride 2 is adopted and it sizes samples down by half.
4.Activation function
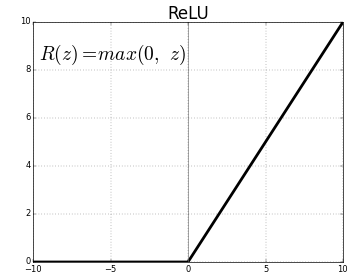 Figure 4 ReLU Function
ReLU is one of activation function which is used in CNN Model. It is used to introduce non-linearity in the model. It is defined as f(x)=max(0,x). It is used to prevent the vanishing gradient problem. The vanishing gradient problem is the problem that the gradient of the loss function with respect to the weights in the network becomes very small as the network becomes deeper. It is caused by the fact that the gradient of the sigmoid function is very small for large values of the input. The ReLU function is a piecewise linear function that will output the input directly if it is positive, otherwise, it will output zero. It is used to prevent the vanishing gradient problem. The vanishing gradient problem is the problem that the gradient of the loss function with respect to the weights in the network becomes very small as the network becomes deeper. It is caused by the fact that the gradient of the sigmoid function is very small for large values of the input. The ReLU function is a piecewise linear function that will output the input directly if it is positive, otherwise, it will output zero.
3.Computation Result and Discussion

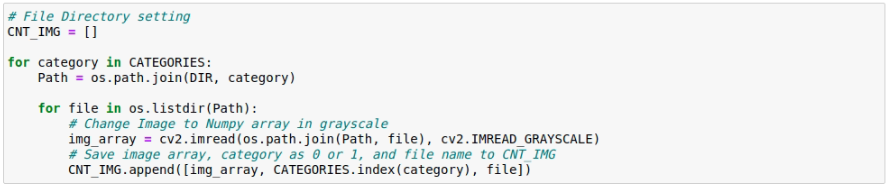 Figure 5 Inital setting
In this process, we add more sample images to improve the acccuracy of the CNN model.
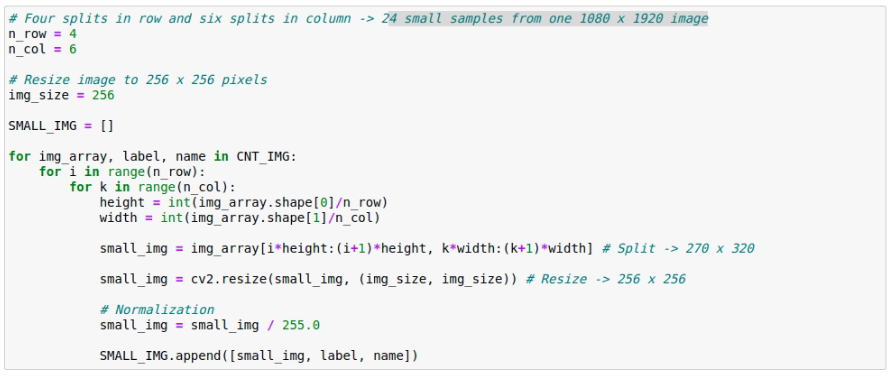
Original Image size is 1080×1920 pixel size. To get better performace, we can divide sample image in smaller size. One 1080 x 1920 image is divided into 24 256 x 256 image samples.

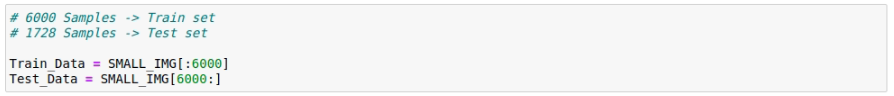
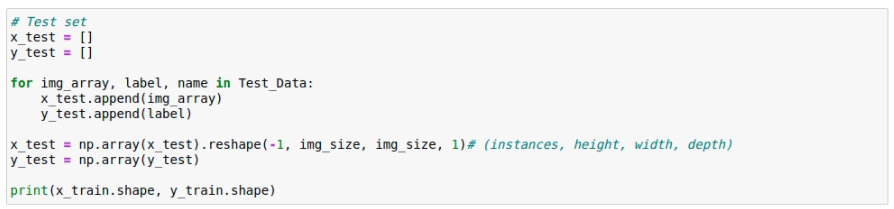
Then, suffle the sample for proper learning and divide sample images into train set and test set.
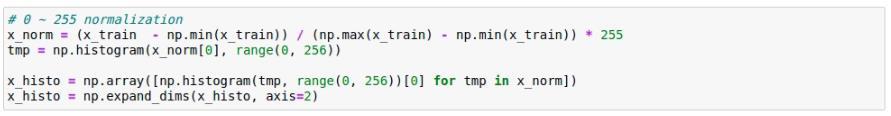
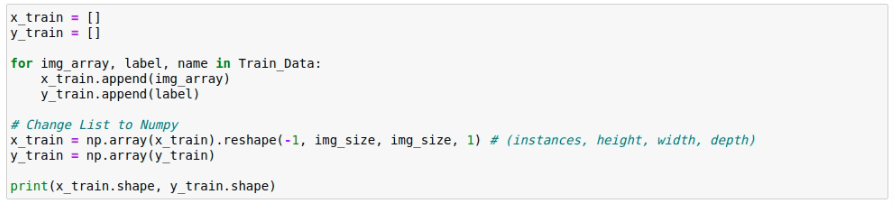
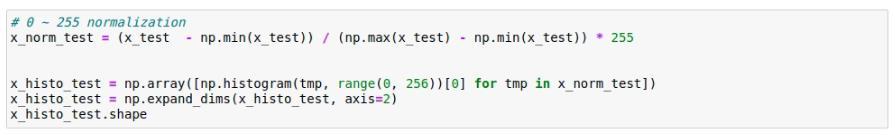
In this model, we use the pixel histogram instead of image itself directly. Conducting normalization to utilize pixel data.
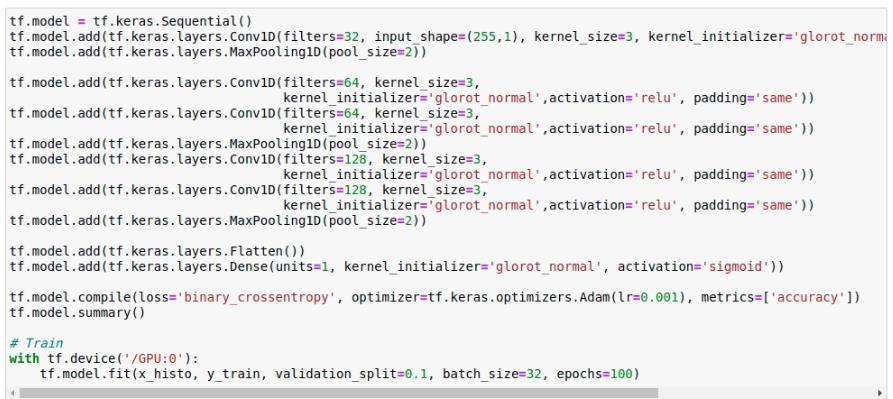
Batch size is adjusted to 32 and epoch is increased to 100 to attain stable result. The learning result is below.
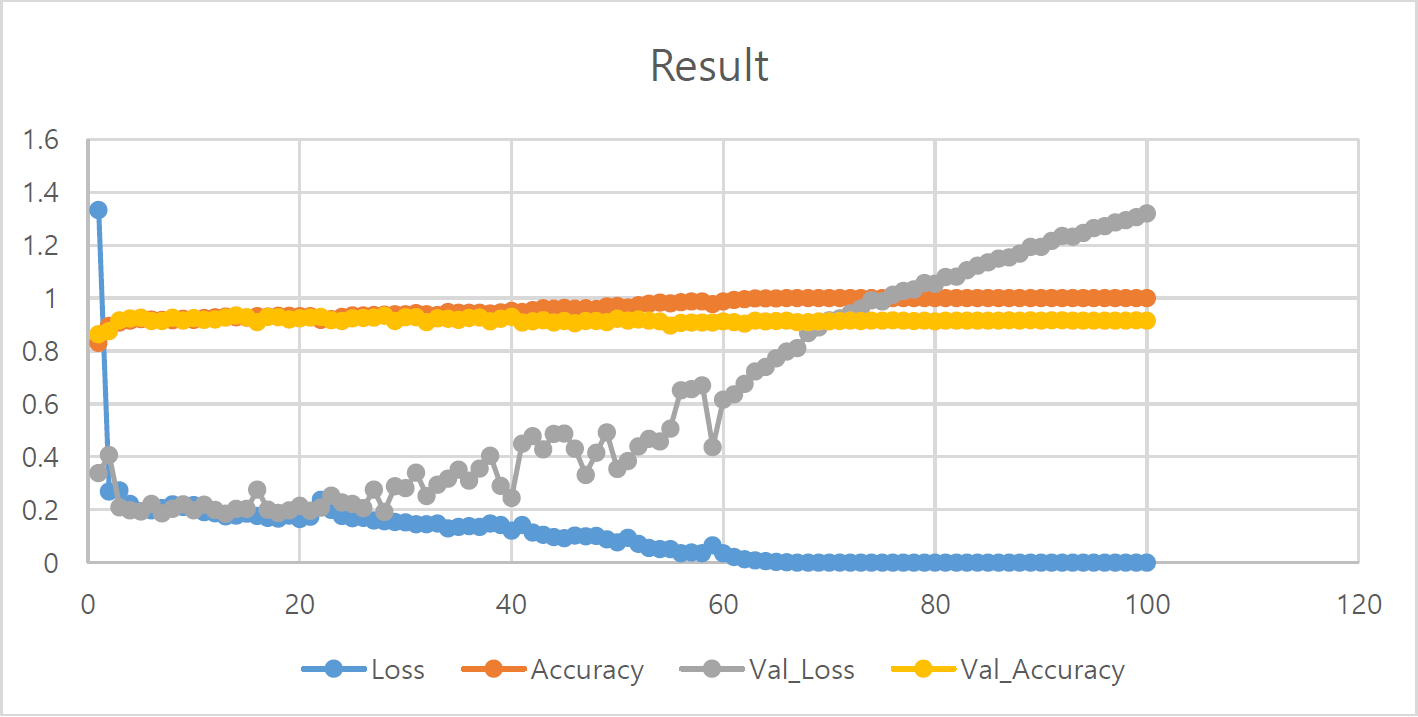
Loss of the model in train set converged to 0 while accuracy converged to 1. It could have issue of overfitting but a tendency that accuracy of validation is converged to 0.915 indicates a probability of properly defined model.
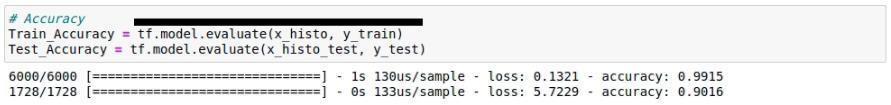
The final accuracy of the improved CNN model is 0.9016 by testset. In this project, we have checked that the importance of sample size and pre-processing in developing accuracy of CNN model. Original advantage of CNN model that doesn’t need a lot of experiences or insights of the experts could be reinforced with simple discern.
4.Reference
[1]https://www.analyticsvidhya.com/blog/2020/10/what-is-the-convolutional-neural-network-architecture/